
To accurately interpret a spectrum analyzer, you should compare peaks with expected signals and watch for artifacts caused by distortion or background noise, which can mislead you. Always check the noise floor to differentiate genuine signals from noise, and guarantee your device is properly calibrated. Recognize the signs of signal distortion and use multiple checks to confirm your findings. Continuing will help you gain deeper insights into how to avoid common pitfalls and improve your analysis skills.

Get audio and creator gear delivered free with Prime
- Fast, free delivery on millions of items
- Prime Video, Amazon Music and more included
- Member-only deals all year
Key Takeaways
- Always compare peaks with known signal characteristics to confirm their authenticity.
- Monitor the noise floor to distinguish genuine signals from background noise.
- Check for signs of signal distortion or artifacts that may mislead interpretation.
- Regularly calibrate the analyzer to ensure measurement accuracy and reliability.
- Use spectral resolution and measurement settings appropriately to resolve close signals accurately.
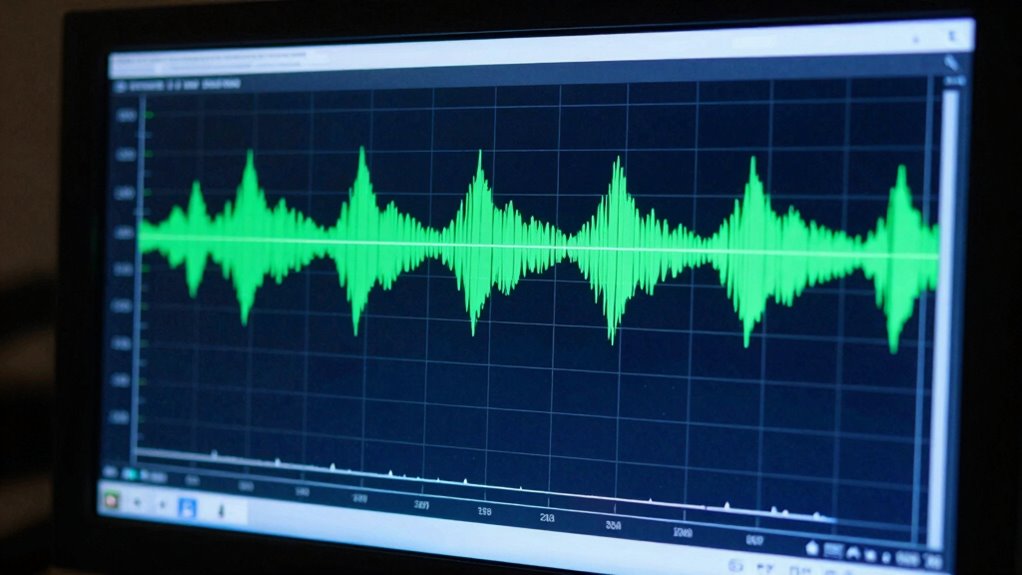
Ever wondered how to decipher the complex display of a spectrum analyzer? Understanding what you see on the screen is essential for accurate analysis, but it can be tricky if you’re not familiar with the key concepts. One common challenge is identifying true signal components amid potential signal distortion and noise. Signal distortion appears when the signal’s shape is altered, often caused by equipment issues or interference. It manifests as unexpected peaks or smearing on the display, making it seem like there’s more activity than there really is. To avoid falling for false positives, you need to compare the spectrum to the expected signal characteristics and consider whether the peaks are consistent or just artifacts from distortion.
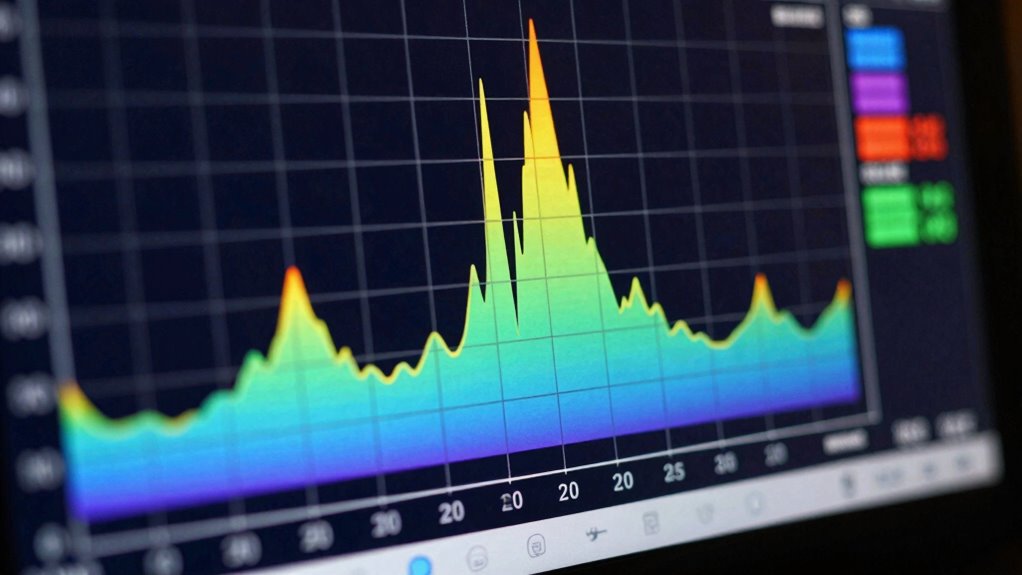
Next, pay attention to the noise floor, which is the baseline level of unwanted signals and background noise present in your measurements. The noise floor sets the limit of your analyzer’s sensitivity; any signal below this level is indistinguishable from the background noise. If you see a small peak near the noise floor, it might not be a real signal but just noise. To accurately interpret your spectrum, you need to know where the noise floor lies and distinguish genuine signals above it from random fluctuations. This means adjusting your device’s resolution bandwidth and input settings to minimize the influence of noise, making sure you’re not fooled into thinking there’s a signal where there isn’t. Additionally, understanding the noise floor and how it affects your readings is crucial for accurate analysis. Being aware of measurement limitations helps you interpret your data more reliably. Recognizing how background noise can mask or mimic real signals is essential for precise measurement. Moreover, understanding the spectral resolution and how it influences your ability to resolve close signals is vital for accurate interpretation.
Furthermore, don’t rely solely on the visual peaks but also consider their relative heights and widths. A true signal typically appears as a distinct, narrow peak, whereas noise tends to be broad and less defined. When you see multiple peaks close together, check if they correspond to known signals or if they could be caused by intermodulation distortion, which creates artificial signals that can mislead your interpretation. Recognizing these patterns helps you differentiate between genuine signals and artifacts caused by signal distortion or measurement limitations. Additionally, understanding the signal distortion and how it can mislead your analysis is essential to avoid misinterpretation of your measurements.
Finally, always calibrate your spectrum analyzer before starting measurements. Proper calibration guarantees that the displayed levels and frequencies are accurate, preventing misinterpretation of the spectrum. Remember, the key to reading a spectrum analyzer without fooling yourself is to stay alert to the noise floor, recognize signs of signal distortion, and verify your findings with known reference signals. This approach ensures you’re making informed decisions based on real signals, not artifacts or measurement errors.
spectrum analyzer calibration kit
As an affiliate, we earn on qualifying purchases.
As an affiliate, we earn on qualifying purchases.
Frequently Asked Questions
What Are Common Mistakes Beginners Make When Interpreting Spectrum Analyzers?
Beginners often mistake poor signal resolution for weak signals or miss details by not adjusting the frequency span properly. You might overlook important signals if you don’t fine-tune the resolution bandwidth, leading to misinterpretation. Always guarantee your signal resolution is set appropriately, especially when analyzing a broad frequency span. This helps you identify signals accurately without false assumptions or missing critical data, making your analysis more reliable.
How Does Environmental Noise Affect Spectrum Analyzer Readings?
Think of environmental noise as a fog clouding your clear view. When ambient noise and interference sources are present, they distort your spectrum analyzer readings, making signals seem stronger or weaker than they truly are. This haze can lead you to misinterpret data or overlook genuine signals. To get accurate results, identify and minimize these interference sources, and always account for ambient noise to see your true signal landscape clearly.
Can Spectrum Analyzers Detect Hidden or Masked Signals?
Yes, spectrum analyzers can detect hidden or masked signals, but it depends on your settings. Signal masking occurs when a strong signal hides a weaker one nearby. By adjusting the resolution bandwidth and using advanced techniques like peak detection and averaging, you can unmask hidden signals. Keep in mind, some signals may still be difficult to identify if they’re heavily masked or deeply embedded beneath stronger signals.
What Are the Differences Between Analog and Digital Spectrum Analyzers?
You see the differences clearly: analog analyzers offer real-time spectrum resolution but have limited frequency span, while digital analyzers provide higher frequency span with precise, stored data. Analog devices excel in instant signal detection, yet digital models allow detailed analysis and filtering. Your choice depends on whether you prioritize immediate visualization or in-depth, accurate measurement across broader frequency ranges. Both serve unique roles in your testing toolkit.
How Should I Calibrate My Spectrum Analyzer for Accurate Measurements?
To calibrate your spectrum analyzer accurately, start with calibration procedures outlined in the user manual. Use reference signals, such as a known RF source, to set baseline measurements. Connect the reference signal, then adjust the analyzer’s calibration controls until the readings match the known signal parameters. Regular calibration guarantees your measurements stay precise, helping you avoid false readings and ensuring consistent, reliable results during your testing.
Conclusion
Now that you know the secrets to reading a spectrum analyzer accurately, the real challenge begins—trusting what you see and making the right call. It’s easy to be fooled by false signals or misinterpret peaks, but with practice, you’ll develop a sharper eye. Will you let uncertainty hold you back, or will you reveal the true potential of your measurements? The choice is yours—dive in, stay alert, and discover what’s truly hidden in the spectrum.
Halloween Picks
halloween
As an affiliate, we earn on qualifying purchases.